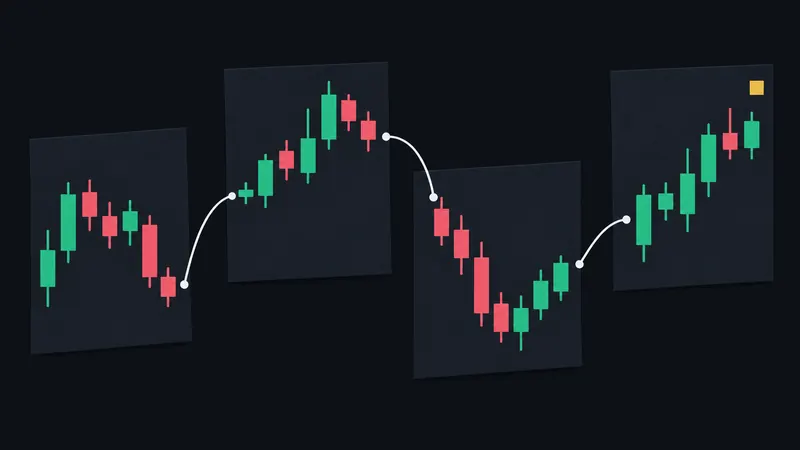
Momentum trading focuses on a strong directional move and the participation behind it. The practical question is not simply whether price is rising or falling. It is whether an entry at the current price still has a defined invalidation point, an acceptable quantity and an exit plan.
A move can remain strong while becoming harder to enter under your rules. That is the difference between observing momentum and chasing it. This guide explains volume, VWAP, extension and risk as parts of a decision process, without predicting the next move or recommending a security.
Momentum trading needs more than a large candle
A large candle shows a change over the interval it summarizes. It does not reveal every transaction within that interval, prove the cause of the move or establish that the next candle will continue. Momentum analysis therefore needs context rather than admiration for the shape.
Look at the movement relative to the preceding structure and the timeframe used. A sharp move on a 1-minute chart can be a small part of a broader range. A cleaner-looking 15-minute chart can hide several reversals that matter to an intraday entry.
Volume can help describe participation, but only if you understand what the data includes and what comparison you are making. Strong price movement with visible activity is an observation. A claim that a particular group is buying, without supporting evidence, is a story.
Momentum can be traded within one session or over a longer horizon. The day trading guide explains the session boundary; the swing trading guide explains the added risk of holding across days. The movement style does not determine the holding plan for you.
Relative volume requires a comparable baseline
Relative volume compares observed volume with a chosen reference. The reference may concern similar periods or a defined historical window, depending on the method. Without a clear denominator, calling volume high is an impression rather than a reproducible comparison.
Time matters. Volume accumulated through the first part of a session is not directly comparable with a full completed day unless the comparison explicitly accounts for that mismatch. Data coverage matters too: one venue's transactions are not the same series as the whole market's consolidated volume.
Blind Drill's stock bars are built from actual IEX trades. Their volume counts IEX trades only, so it can look lower than the volume on other charts. A low number on this feed does not establish that the entire market was inactive.
The Volume indicator shows activity in the replay feed. It is not a consolidated-market relative-volume measure. Use it to understand the replay's own series, keeping the source and comparison period consistent.
That distinction avoids a common error: using a familiar label while changing the data beneath it. A comparison becomes useful when both sides describe the same thing. Otherwise apparent differences can come from coverage rather than trader behavior.
VWAP is a reference, not an instruction
VWAP means volume-weighted average price. It summarizes traded prices with weights related to volume over a defined period. The starting point and data feed matter, which is why two charts can show different values without either number being a universal market truth.
In Blind Drill stock sessions, VWAP is measured from the 09:30 ET open. Stock bars cover 04:00 to 16:00 ET, but pre-market coverage does not move that stated VWAP anchor. For crypto, VWAP begins at 00:00 UTC, the start of the UTC calendar day.
Price above VWAP tells you where the current price sits relative to that reference. It does not guarantee support, justify an entry or prove that a pullback will stop there. Price below VWAP carries the same limitation in the opposite direction.
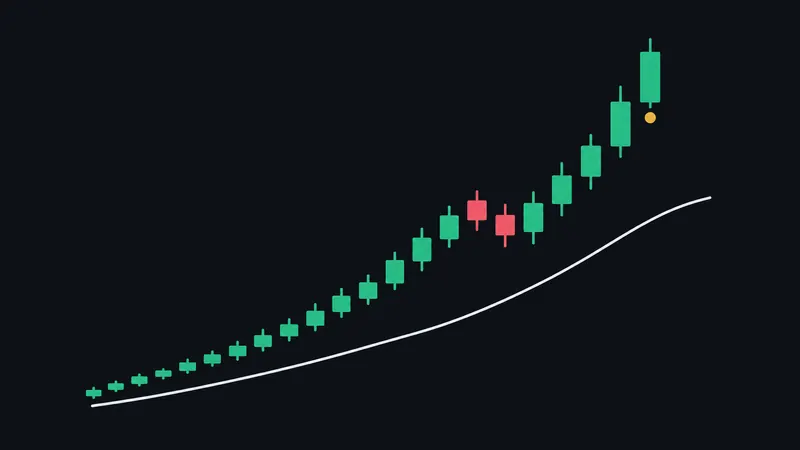
Use the line to ask a measured question: how far has price moved from the session reference, and what does that distance do to this proposed entry? The answer still needs the stop, quantity and management plan. An indicator cannot supply those decisions by itself.
The difference between momentum and chasing
Momentum describes the market movement. Chasing describes an entry decision made after extension without adequately reassessing the terms. They can occur together, but they are not the same concept.
Suppose a hypothetical entry was planned near $100 with an invalidation at $99.50. If price reaches $102 before you act, the original $0.50 distance has become $2.50 if that stop remains unchanged. The same share count now carries five times the planned price risk before costs.
That arithmetic does not say the move must reverse. It says the trade has changed. Keeping the old narrative while accepting the new exposure is the problem. You can reassess, reduce quantity under the chosen budget or pass; the original entry cannot be recovered by pretending the current price is the old one.
By default, Blind Drill flags a long entry more than 1.5% above VWAP or a short entry more than 1.5% below VWAP and deducts 10 discipline points. The threshold is adjustable before the first fill. It is a training rule, not a claim that 1.5% is a universal boundary between valid and invalid momentum trades.
For a hypothetical VWAP of $100, a long entry at $102 is 2% above it and a short entry at $98 is 2% below it. Both exceed the default threshold. A short at $102 or a long at $98 is not flagged by this directional check. Exactly 1.5% does not exceed the threshold. None of these comparisons predicts the next price move.
Give the setup a place where it can fail
An invalidation point should relate to the idea being tested. If the reason for entry disappears, the plan needs an exit response. Choosing a stop only because it produces a convenient share count reverses that logic.
A pullback, a breakout attempt and a continuation after consolidation can require different conditions. Do not merge them into one vague instruction to join strength. Describe the structure you need to see and the observation that would make you pass.
Then check whether the entry is still near enough to the invalidation point to fit your risk budget. If the distance is too large, the quantity calculation may produce a position different from the one you imagined. That is information, not an inconvenience to erase by moving the stop closer without reason.
A tighter stop can reduce the planned distance while making the setup easier to invalidate. A wider stop can fit the structure while increasing per-share risk. Neither choice is automatically superior. What matters is whether the chosen distance, quantity and explanation belong to the same plan.
Calculate quantity after choosing the entry and stop
For a simplified stock example before costs, divide the dollar risk budget by stop distance per share. A hypothetical $120 budget and $0.60 distance allow 200 shares. If extension increases the distance to $1.20, the same budget allows 100 shares.
The calculation should be refreshed when the entry changes. A planned market order may fill at a different price, and slippage can enlarge the realized distance. A stop price is not a guarantee of a maximum loss, particularly when prices jump across levels.
Blind Drill's "Size to my risk" tool calculates the quantity from the stop and risk limit. The live preview displays dollar risk, account percentage, reward and risk to reward ratio. Use it to inspect the order you are about to place, rather than remembering a quantity from an earlier candle.
Costs deserve the same attention as direction. If the intended holding period is very short, read the scalping guide for worked examples of the default stock and crypto costs. A strong move does not waive the commission or guarantee the fill.
Decide how to respond when momentum changes
An exit plan can refer to a target, invalidation, a time condition or a specified change in structure. Define the condition before the position is open. Otherwise every pause can become either a reason to leave or a reason to add, depending on the current P&L.
A pullback is not automatically a reversal, but that observation cannot justify unlimited risk. If the preselected invalidation is reached, describing the movement as normal does not change the original rule. The plan must state what action follows.
Moving a stop further away changes the exposure after entry. Adding to a losing position changes it again. Blind Drill treats each of these as a 15-point discipline deduction. The score gives you an explicit record of the behavior even if the market later moves favorably.
Review the exit under the replay's fill model. When a single bar touches both stop and target, the system assumes the stop was hit first. There is no tick sequence available to prove which occurred first in the live market. A bar result is therefore a modeled result, not an exact reconstruction of every executable moment.
Do not confuse a missed move with a trading mistake
After a large move, an earlier entry can look obvious. At the time, the continuation was unknown. Your review should preserve that uncertainty rather than grading every decision with the completed chart.
A missed move is a process error only if it violated a rule or condition you intended to follow. If the setup never met your criteria, passing can be consistent even when the later chart is dramatic. Otherwise every strong day teaches the same unhelpful lesson: loosen the rules until you would have participated.
The opposite distortion is letting a winning chase justify the entry. A favorable outcome does not reduce the risk accepted at the moment of decision. Keep the rule evaluation separate from the result so that both remain visible.
Repeatedly replaying a known day also changes the exercise. Recognizing the eventual path can influence your timing without conscious intention. A hidden ticker and date help reduce obvious hindsight cues, but no replay should be treated as a perfect substitute for live uncertainty.
Common momentum mistakes have observable traces
The mistakes worth reviewing are concrete: an entry made far from the reference without recalculating size; a stop moved away after price weakened; a new trade taken because the previous one lost; a daily or trade-count limit crossed while the chart still looked active.
Those actions leave timestamps, quantities and order changes. Use them. A label such as impatient or emotional is less useful than identifying the exact check that was skipped. The next exercise can then test that check directly.
| Observation | Question for review |
|---|---|
| Entry moved further from the stop | Was quantity recalculated? |
| Price moved far from VWAP | Did the chosen distance rule permit entry? |
| Volume looked unusual | Was the comparison based on the same coverage? |
| Position moved against the idea | Was invalidation honored or rewritten? |
| Another entry followed a loss | Did a new setup exist under the original rules? |
Avoid changing all the rules at once after one session. A different result on the next day may reflect different market conditions rather than an improved method. Make a narrow adjustment and describe what evidence you will use to judge it.
Practice extension without knowing the ending
In a blind drill, the server releases historical bars one step at a time. The ticker and date remain hidden until the session ends. For stocks, the selected lively days have first-two-hour movement at least as large as that stock's typical day in the library. That selection is useful practice context, not a representative sample of every market day.
Set a VWAP distance rule, a per-trade risk limit and a maximum trade count before the first fill. Keep the objective simple: when entry changes, reassess the stop distance and quantity. Use pause or next bar if you need time to articulate the decision.
The replay walkthrough explains the controls, data coverage and scorecard. At the end, compare the timed discipline breaks with your notes before judging the simulated P&L. Review whether you followed the rule when a strong move made waiting uncomfortable.
Take one observation into the next hidden day. The purpose is to practice a repeatable response to extension, not to prove that a particular indicator predicts the future. Simulated results do not predict live results, and a well-followed exercise can still contain losing trades.